Offshore wind power in Japan is increasingly expected to become a mainstream renewable energy source, and establishing supportive regulatory frameworks is crucial to accelerate its deployment. In particular, the 2018 “Renewable Sea Area Utilization Act” (Act Concerning the Promotion of the Use of Sea Areas for Marine Renewable Energy Power Facilities) provides an essential institutional foundation for offshore wind development.
For an overview of the Renewable Sea Area Utilization Act, see here.
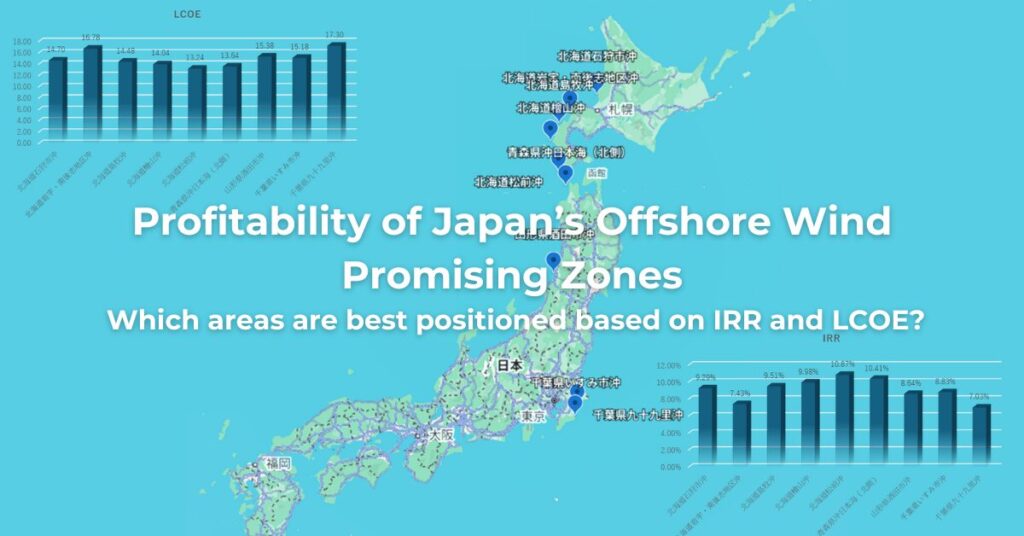
This article analyzes the nine “promising zones” designated under the Act as of January 2025, estimating four key investment metrics and ranking each zone’s competitiveness based on investment viability. Which zones will likely be selected in the next bidding round (Round 4)?
- CAPEX (capital expenditure) & OPEX (operational expenditure)
- AEP (annual energy production)
- IRR (internal rate of return)
- LCOE (levelized cost of energy)
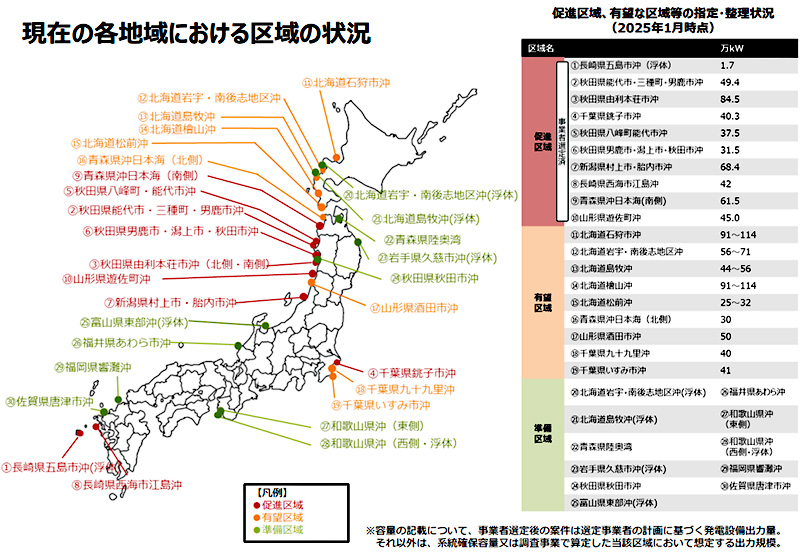
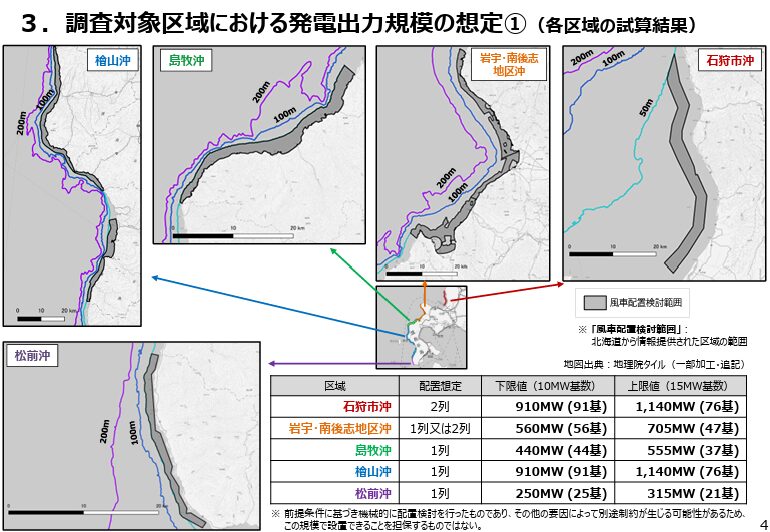
Promising Zones and Generation Capacity
As of January 2025, the Ministry of Economy, Trade and Industry (METI) has designated nine promising offshore zones, with estimated capacities as follows:
| Promising Zones | Capacity (MW) |
|---|---|
| Offshore of Ishikari, Hokkaido | 910–1,140 |
| Offshore of Iwao & Minami-Shiribeshi, Hokkaido | 560–705 |
| Offshore of Shimamaki, Hokkaido | 440–555 |
| Offshore of Hiyama, Hokkaido | 910–1,140 |
| Offshore of Matsumae, Hokkaido | 250–315 |
| Offshore Northern Sea of Aomori | 300 |
| Offshore of Sakata, Yamagata | 500 |
| Offshore of Isumi, Chiba | 400 |
| Offshore of Kujūkuri, Chiba | 410 |
The variance in Hokkaido capacities reflects different turbine models (10 MW vs. 15 MW).
CAPEX & OPEX Estimates
Based on NEDO’s offshore wind cost model as of October 2024, we estimated the capital expenditure (CAPEX) and operational expenditure (OPEX) for the nine zones designated as “promising areas” under the Renewable Sea Area Utilization Act. For the Hokkaido zones, the estimates assume the adoption of 15 MW turbines at maximum capacity, while for the other regions, 10 MW turbines are assumed.
| Promising Zones | Capacity | Turbines | CAPEX (¥ billion) | OPEX (¥ billion) |
|---|---|---|---|---|
| Ishikari, Hokkaido | 1,140 MW | 15 MW × 76 | 469.7 | 8.1 |
| Iwao/Minami-Shiribeshi, Hokkaido | 705 MW | 15 MW × 47 | 290.5 | 5.0 |
| Shimamaki, Hokkaido | 555 MW | 15 MW × 37 | 228.7 | 3.9 |
| Hiyama, Hokkaido | 1,140 MW | 15 MW × 76 | 469.7 | 8.1 |
| Matsumae, Hokkaido | 315 MW | 15 MW × 21 | 129.8 | 2.2 |
| Northern Sea of Aomori | 300 MW | 10 MW × 30 | 123.6 | 2.1 |
| Sakata, Yamagata | 500 MW | 10 MW × 50 | 206.0 | 3.5 |
| Isumi, Chiba | 400 MW | 10 MW × 40 | 164.8 | 2.8 |
| Kujūkuri, Chiba | 410 MW | 10 MW × 41 | 168.9 | 2.9 |
AEP (Annual Energy Production) Estimates
For the nine zones designated as “promising areas” under the Renewable Sea Area Utilization Act, we estimated the annual energy production (AEP) using estimated power curves (15 MW and 10 MW) derived from rated output and wind condition data from NEDO’s NeoWins.
| Promising Zones | Rated Power | Gross Capacity Factor | Net Capacity Factor (with loss) | AEP (kWh) |
|---|---|---|---|---|
| Ishikari, Hokkaido | 15 MW | 39.64% | 31.71% | 3,166,887,168 |
| Iwao/Minami-Shiribeshi, Hokkaido | 15 MW | 34.73% | 27.78% | 1,715,884,272 |
| Shimamaki, Hokkaido | 15 MW | 40.24% | 32.19% | 1,565,110,656 |
| Hiyama, Hokkaido | 15 MW | 41.52% | 33.22% | 3,317,082,624 |
| Matsumae, Hokkaido | 15 MW | 44.00% | 35.20% | 971,308,800 |
| Northern Sea of Aomori | 10 MW | 42.72% | 34.18% | 898,145,280 |
| Sakata, Yamagata | 10 MW | 37.88% | 30.30% | 1,327,315,200 |
| Isumi, Chiba | 10 MW | 38.39% | 30.71% | 1,076,148,480 |
| Kujūkuri, Chiba | 10 MW | 33.69% | 26.95% | 968,008,032 |
IRR & LCOE Estimates
For the nine zones designated as “promising areas” under the Renewable Sea Area Utilization Act, we calculated the IRR (internal rate of return) and LCOE (levelized cost of energy), which are commonly used indicators for investment evaluation. The following assumptions were applied:
- WACC (weighted average cost of capital): 6.5%
- Operational period of the wind farm: 25 years
- Power selling price: ¥18/kWh
| Promising Zones | IRR (%) | LCOE (¥/kWh) |
|---|---|---|
| Ishikari, Hokkaido | 9.29 | 14.70 |
| Iwao/Minami-Shiribeshi, Hokkaido | 7.43 | 16.78 |
| Shimamaki, Hokkaido | 9.51 | 14.48 |
| Hiyama, Hokkaido | 9.98 | 14.04 |
| Matsumae, Hokkaido | 10.87 | 13.24 |
| Northern Sea of Aomori | 10.41 | 13.64 |
| Sakata, Yamagata | 8.64 | 15.38 |
| Isumi, Chiba | 8.83 | 15.18 |
| Kujūkuri, Chiba | 7.03 | 17.30 |
Competitiveness Evaluation for 9 zones
Zones were rated on a 5‑tier scale based on IRR and LCOE:The competitiveness of the nine zones designated as “promising areas” under the Renewable Sea Area Utilization Act was evaluated on a five-level scale from the perspective of investment profitability.
Evaluation Criteria
| Rating | IRR | LCOE | Comments |
|---|---|---|---|
| ★★★★★ Very Promising | ≥ 9.5 % | ≤ 15 ¥/kWh | Both investment viability and power generation efficiency are exceptionally high. A zone that should be given top priority. |
| ☆☆☆☆ Promising | 8–9.5 % | 15–17 ¥/kWh | High investment potential; profitability is achievable depending on other factors such as port and grid infrastructure. |
| ☆☆☆ Neutral | 6.5–8 % | 17–19 ¥/kWh | Potentially viable depending on conditions. Cost reductions and support measures will be key. |
| ☆☆ Challenging | 5–6.5 % | 19–22 ¥/kWh | Profitability is somewhat low and would require technical and regulatory support as a prerequisite. |
| ☆ Unprofitable | < 5 % | > 22 ¥/kWh | Currently challenging. Fundamental regulatory support or technological innovation is necessary. |
Evaluation result
| Promising Zones | IRR | LCOE | Rating |
|---|---|---|---|
| Ishikari, Hokkaido | 9.29 | 14.70 | ☆☆☆☆ |
| Iwao/Minami-Shiribeshi, Hokkaido | 7.43 | 16.78 | ☆☆☆ |
| Shimamaki, Hokkaido | 9.51 | 14.48 | ★★★★★ |
| Hiyama, Hokkaido | 9.98 | 14.04 | ★★★★★ |
| Matsumae, Hokkaido | 10.87 | 13.24 | ★★★★★ |
| Northern Sea of Aomori | 10.41 | 13.64 | ★★★★★ |
| Sakata, Yamagata | 8.64 | 15.38 | ☆☆☆☆ |
| Isumi, Chiba | 8.83 | 15.18 | ☆☆☆☆ |
| Kujūkuri, Chiba | 7.03 | 17.30 | ☆☆☆ |
Summary
Analyzing the nine promising zones designated under the Act, four zones exhibited particularly strong investment metrics and competitiveness:
- Offshore Shimamaki, Hokkaido
- Offshore Hiyama, Hokkaido
- Offshore Matsumae, Hokkaido
- Northern Sea off Aomori
The remaining five zones also showed feasible profitability; with further cost reductions or policy support, they may become commercially viable. This analysis aims to assist private developers and investors in evaluating potential areas and informing policy design and Round 4 bidding decisions.
📚 Want to dive deeper? Explore J-WIND Times’ featured categories!
🔍 Market Trends & Analysis – Stay ahead with insights into the latest developments shaping renewable energy investments.
🏛 Policy & Regulation – From auction schemes to FIP reform, get a clear understanding of Japan’s evolving energy rules.
⚙️ Projects – Discover the progress and behind-the-scenes of offshore wind projects across Japan.
💡 Technology & Innovation – From next-gen turbines to floating foundations, explore the cutting edge of offshore wind tech.